Research & Writing

May 28, 2026
Unlocking new Credit Risk signals from unstructured data with Mechanistic Interpretability

April 29, 2026
The Missing Agent: Why AI Needs an Explainable Decision-Maker

March 31, 2026
Black Box to Glass Box: Audit-Ready AI

February 13, 2026
Mapping Concept Evolution in Qwen3

February 9, 2026
BluelightAI Research Fellowship

December 18, 2025
Circuit Tracing with the Qwen3 Cross-Layer Transcoders

December 4, 2025
Cross Layer Transcoders for the Qwen3 LLM Family

December 3, 2025
Introducing Cross-Layer Transcoders for Qwen3

November 9, 2025
From Black Box to Audit Trail: How BluelightAI Makes LLM Decisions Explainable

November 2, 2025
The Regulatory Horizon for AI Companies: What to Know and How to Prepare

September 18, 2025
Signal Processing for AI

September 5, 2025
Graph Modeling for Mechanistic Interpretability

July 23, 2025
Topological Feature Generation for Speech Recognition

July 7, 2025
Using TDA and Sparse Autoencoders to Evaluate TruthfulQA

June 27, 2025
Feature Engineering for Language Models
June 18, 2025
Why Your AI Needs Cobalt: Adapt, Diagnose, and Deploy with Confidence

June 6, 2025
Mechanistic Interpretability in Practice: Applying TDA to Breast Cancer
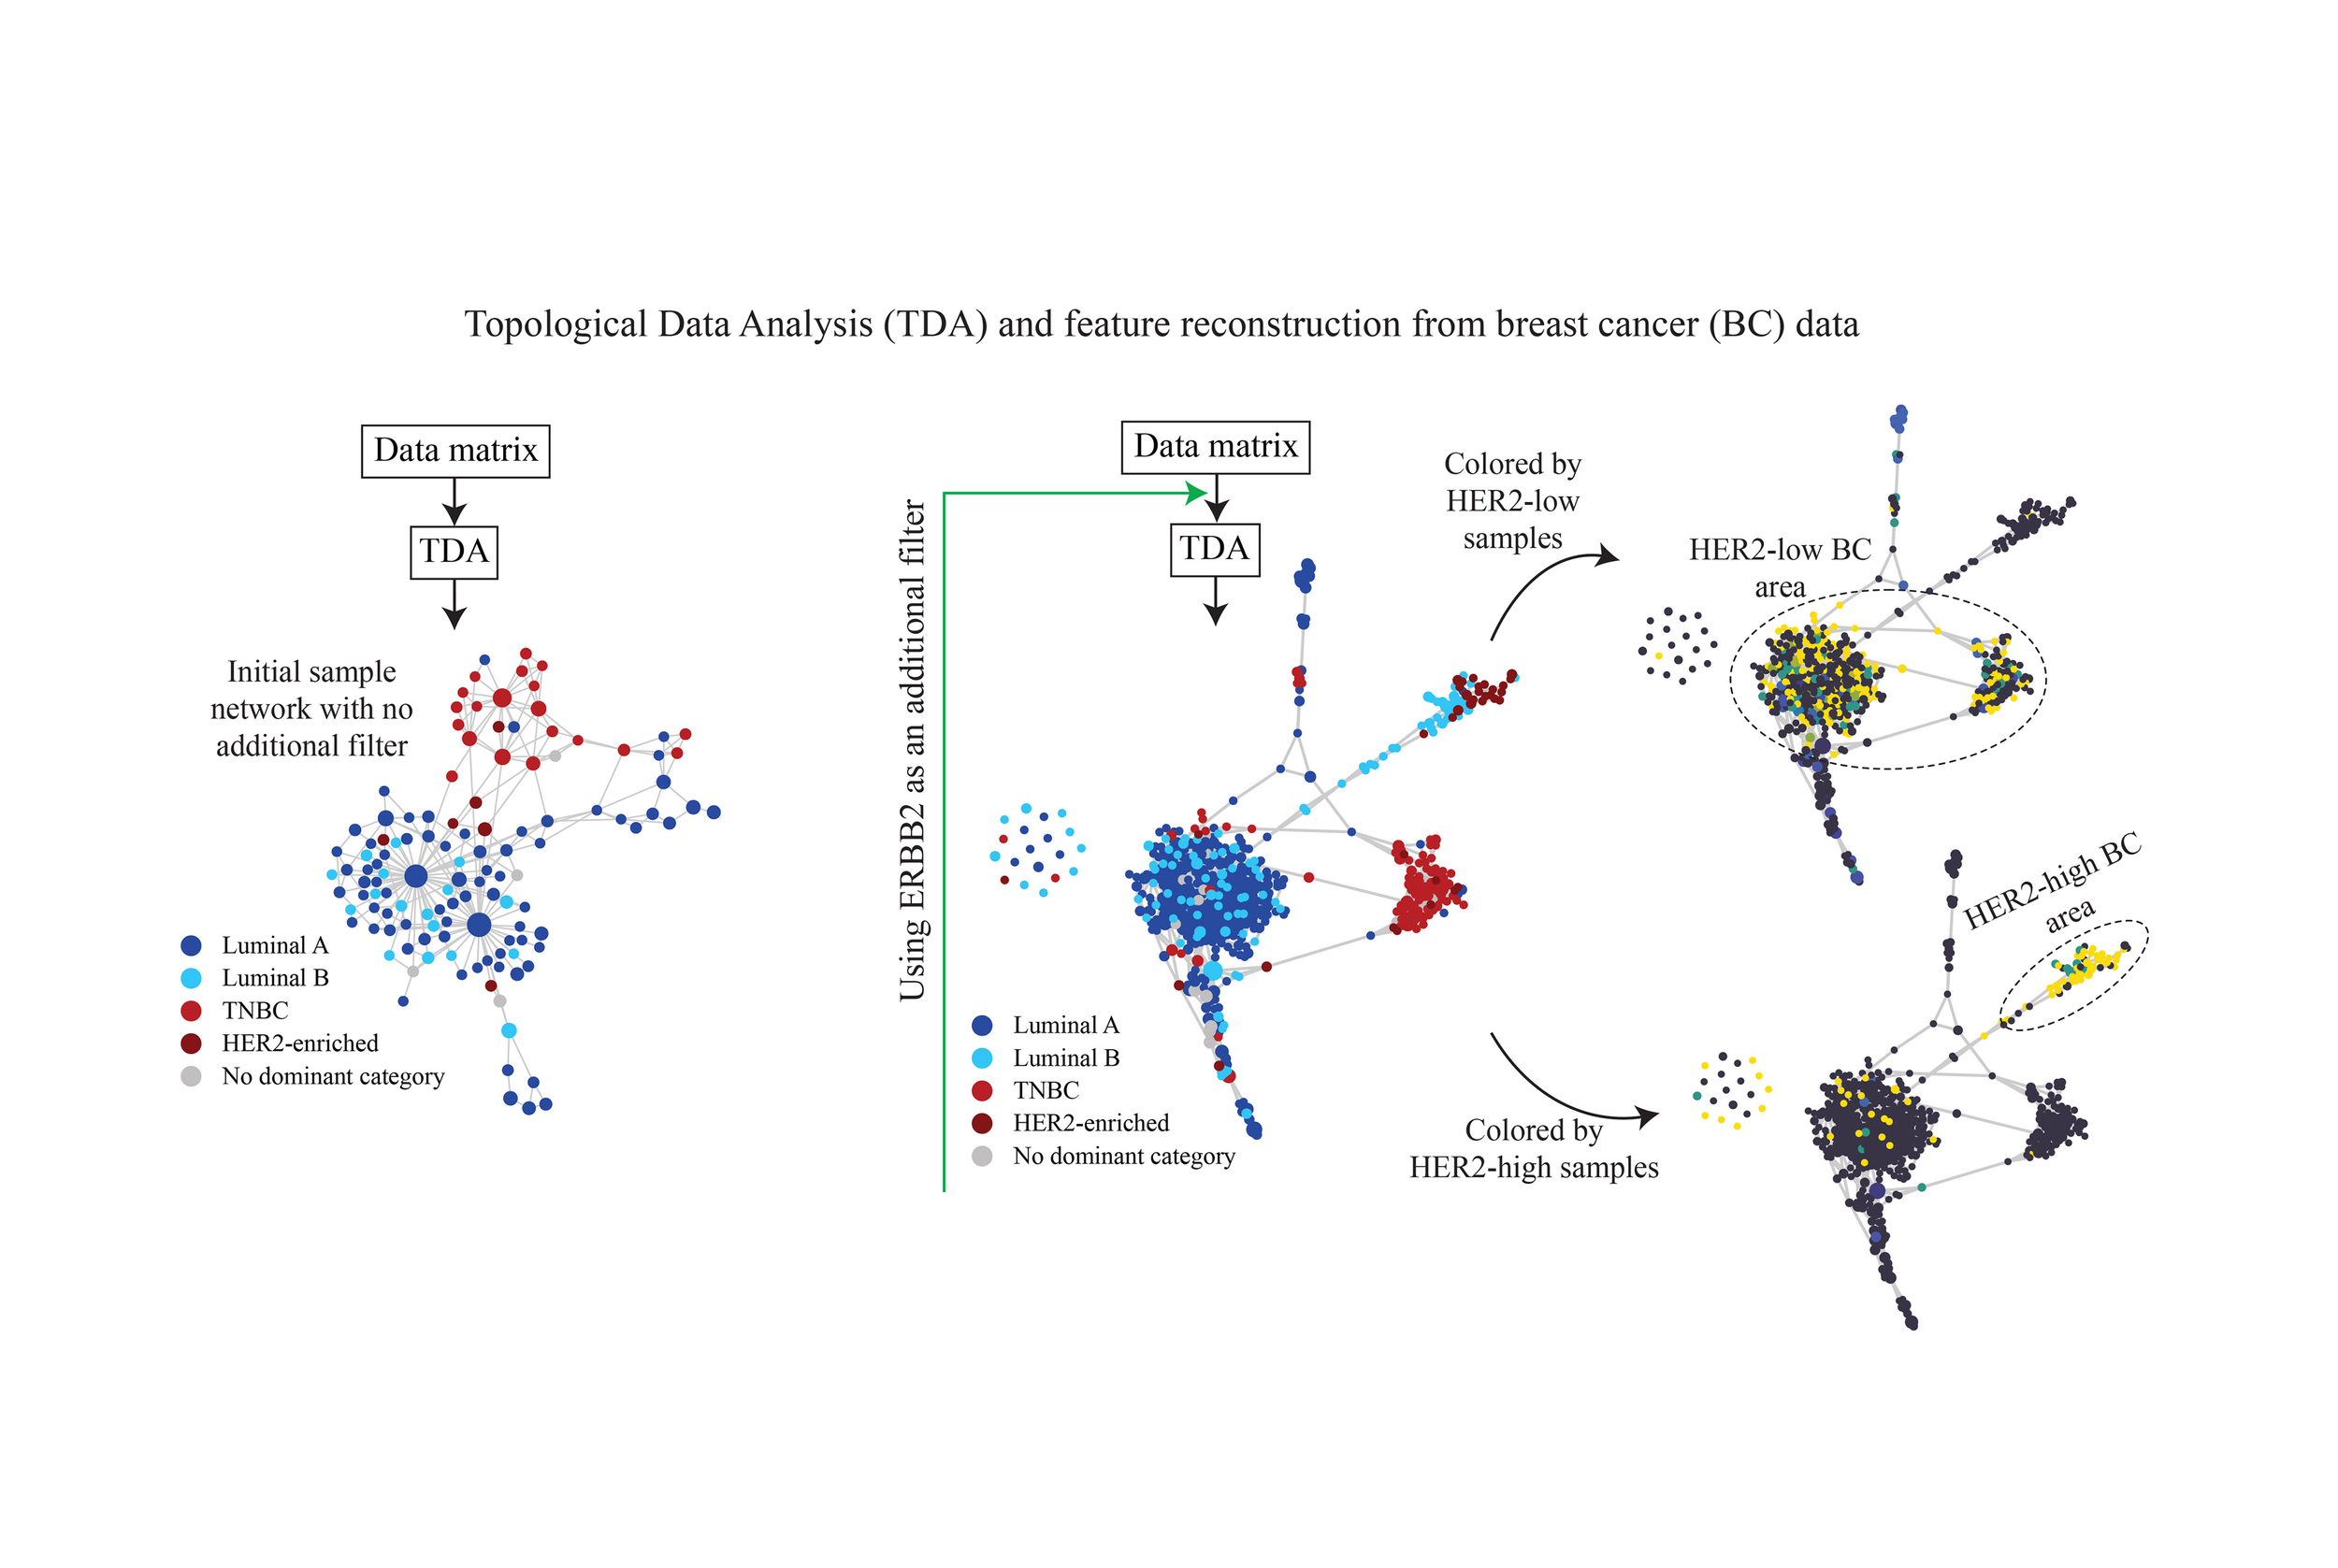
May 30, 2025
Topological Data Analysis Reveals a Subgroup of Luminal B Breast Cancer

May 23, 2025
Next Generation AI Model Evaluation
May 15, 2025
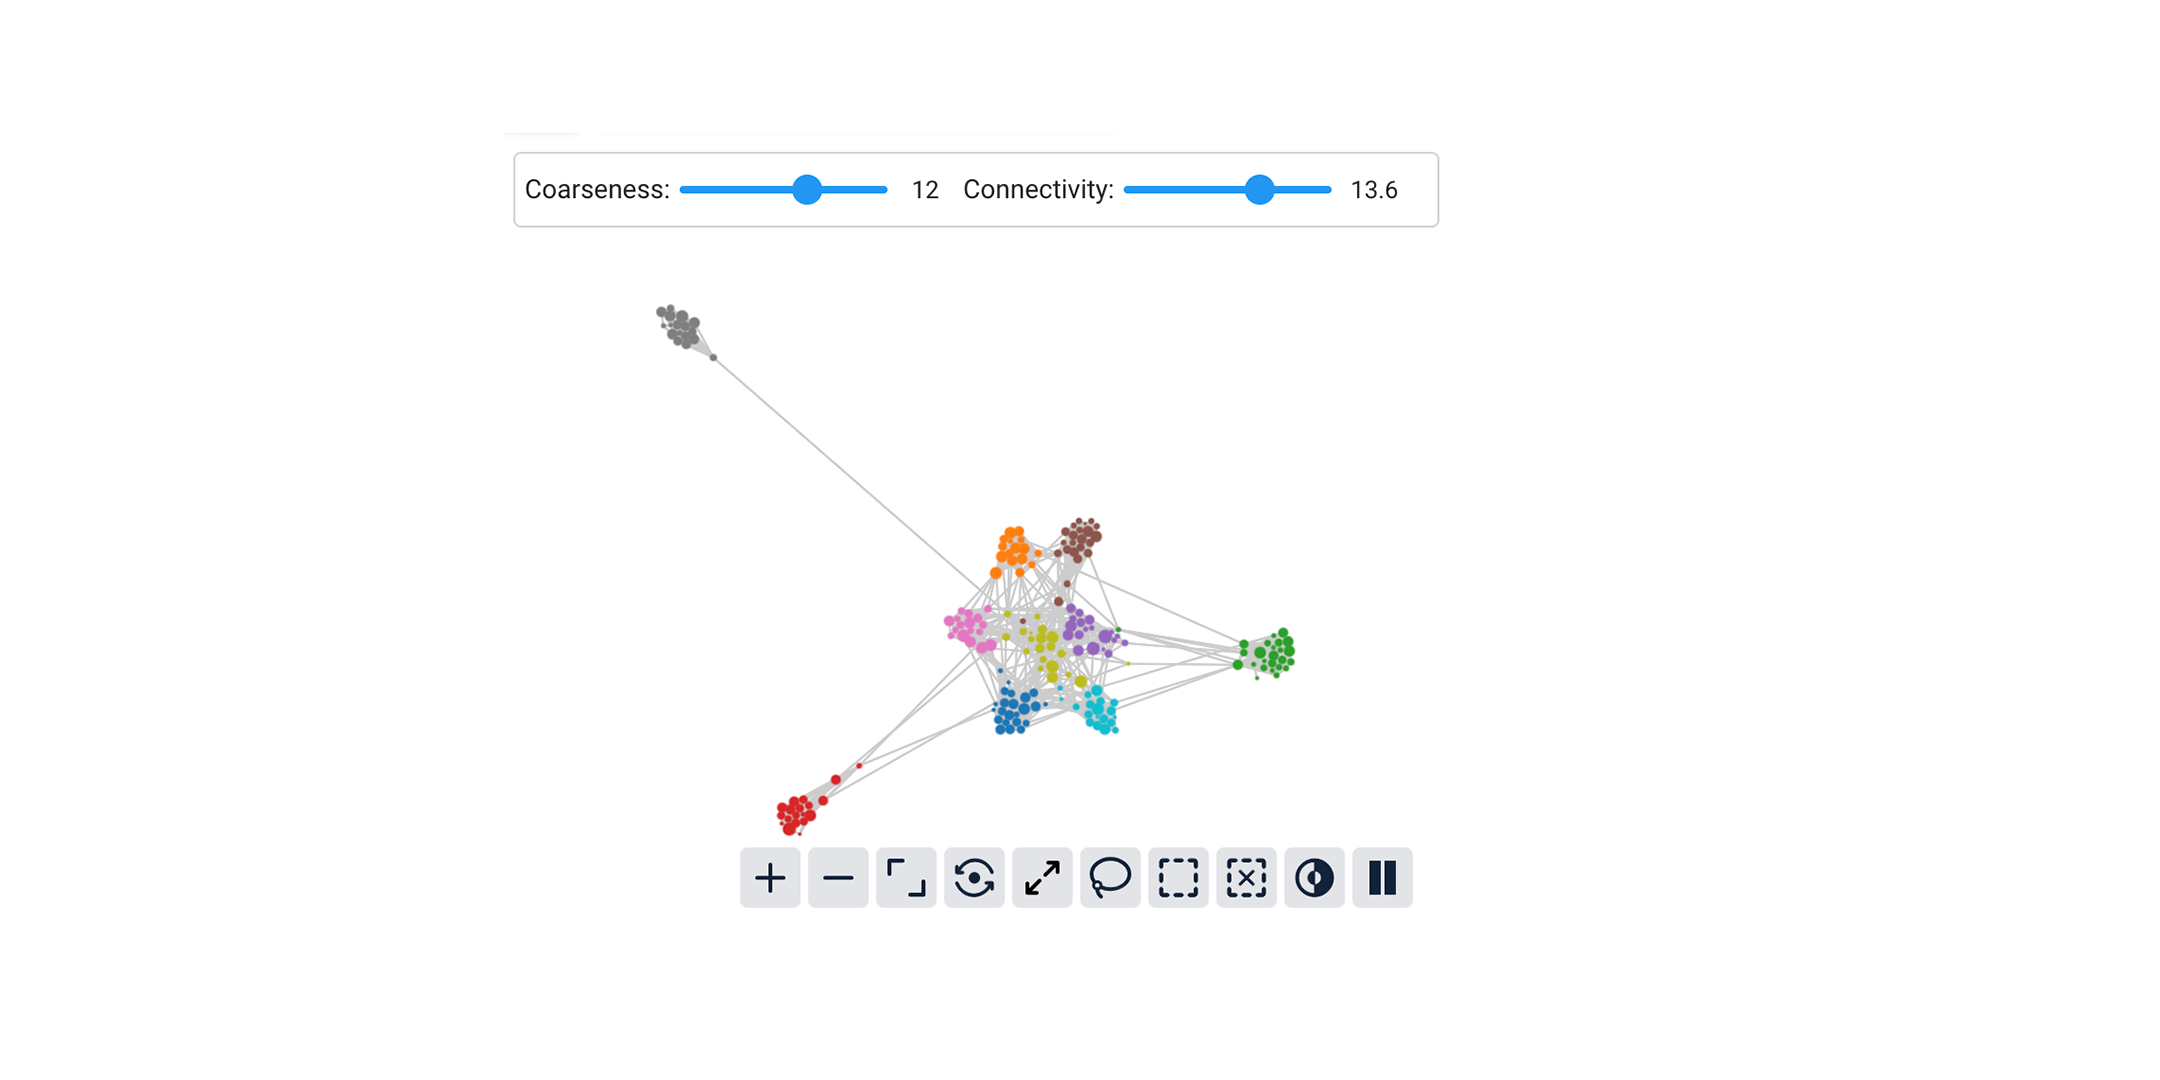
New Release: Cobalt Version 0.3.9
April 24, 2025
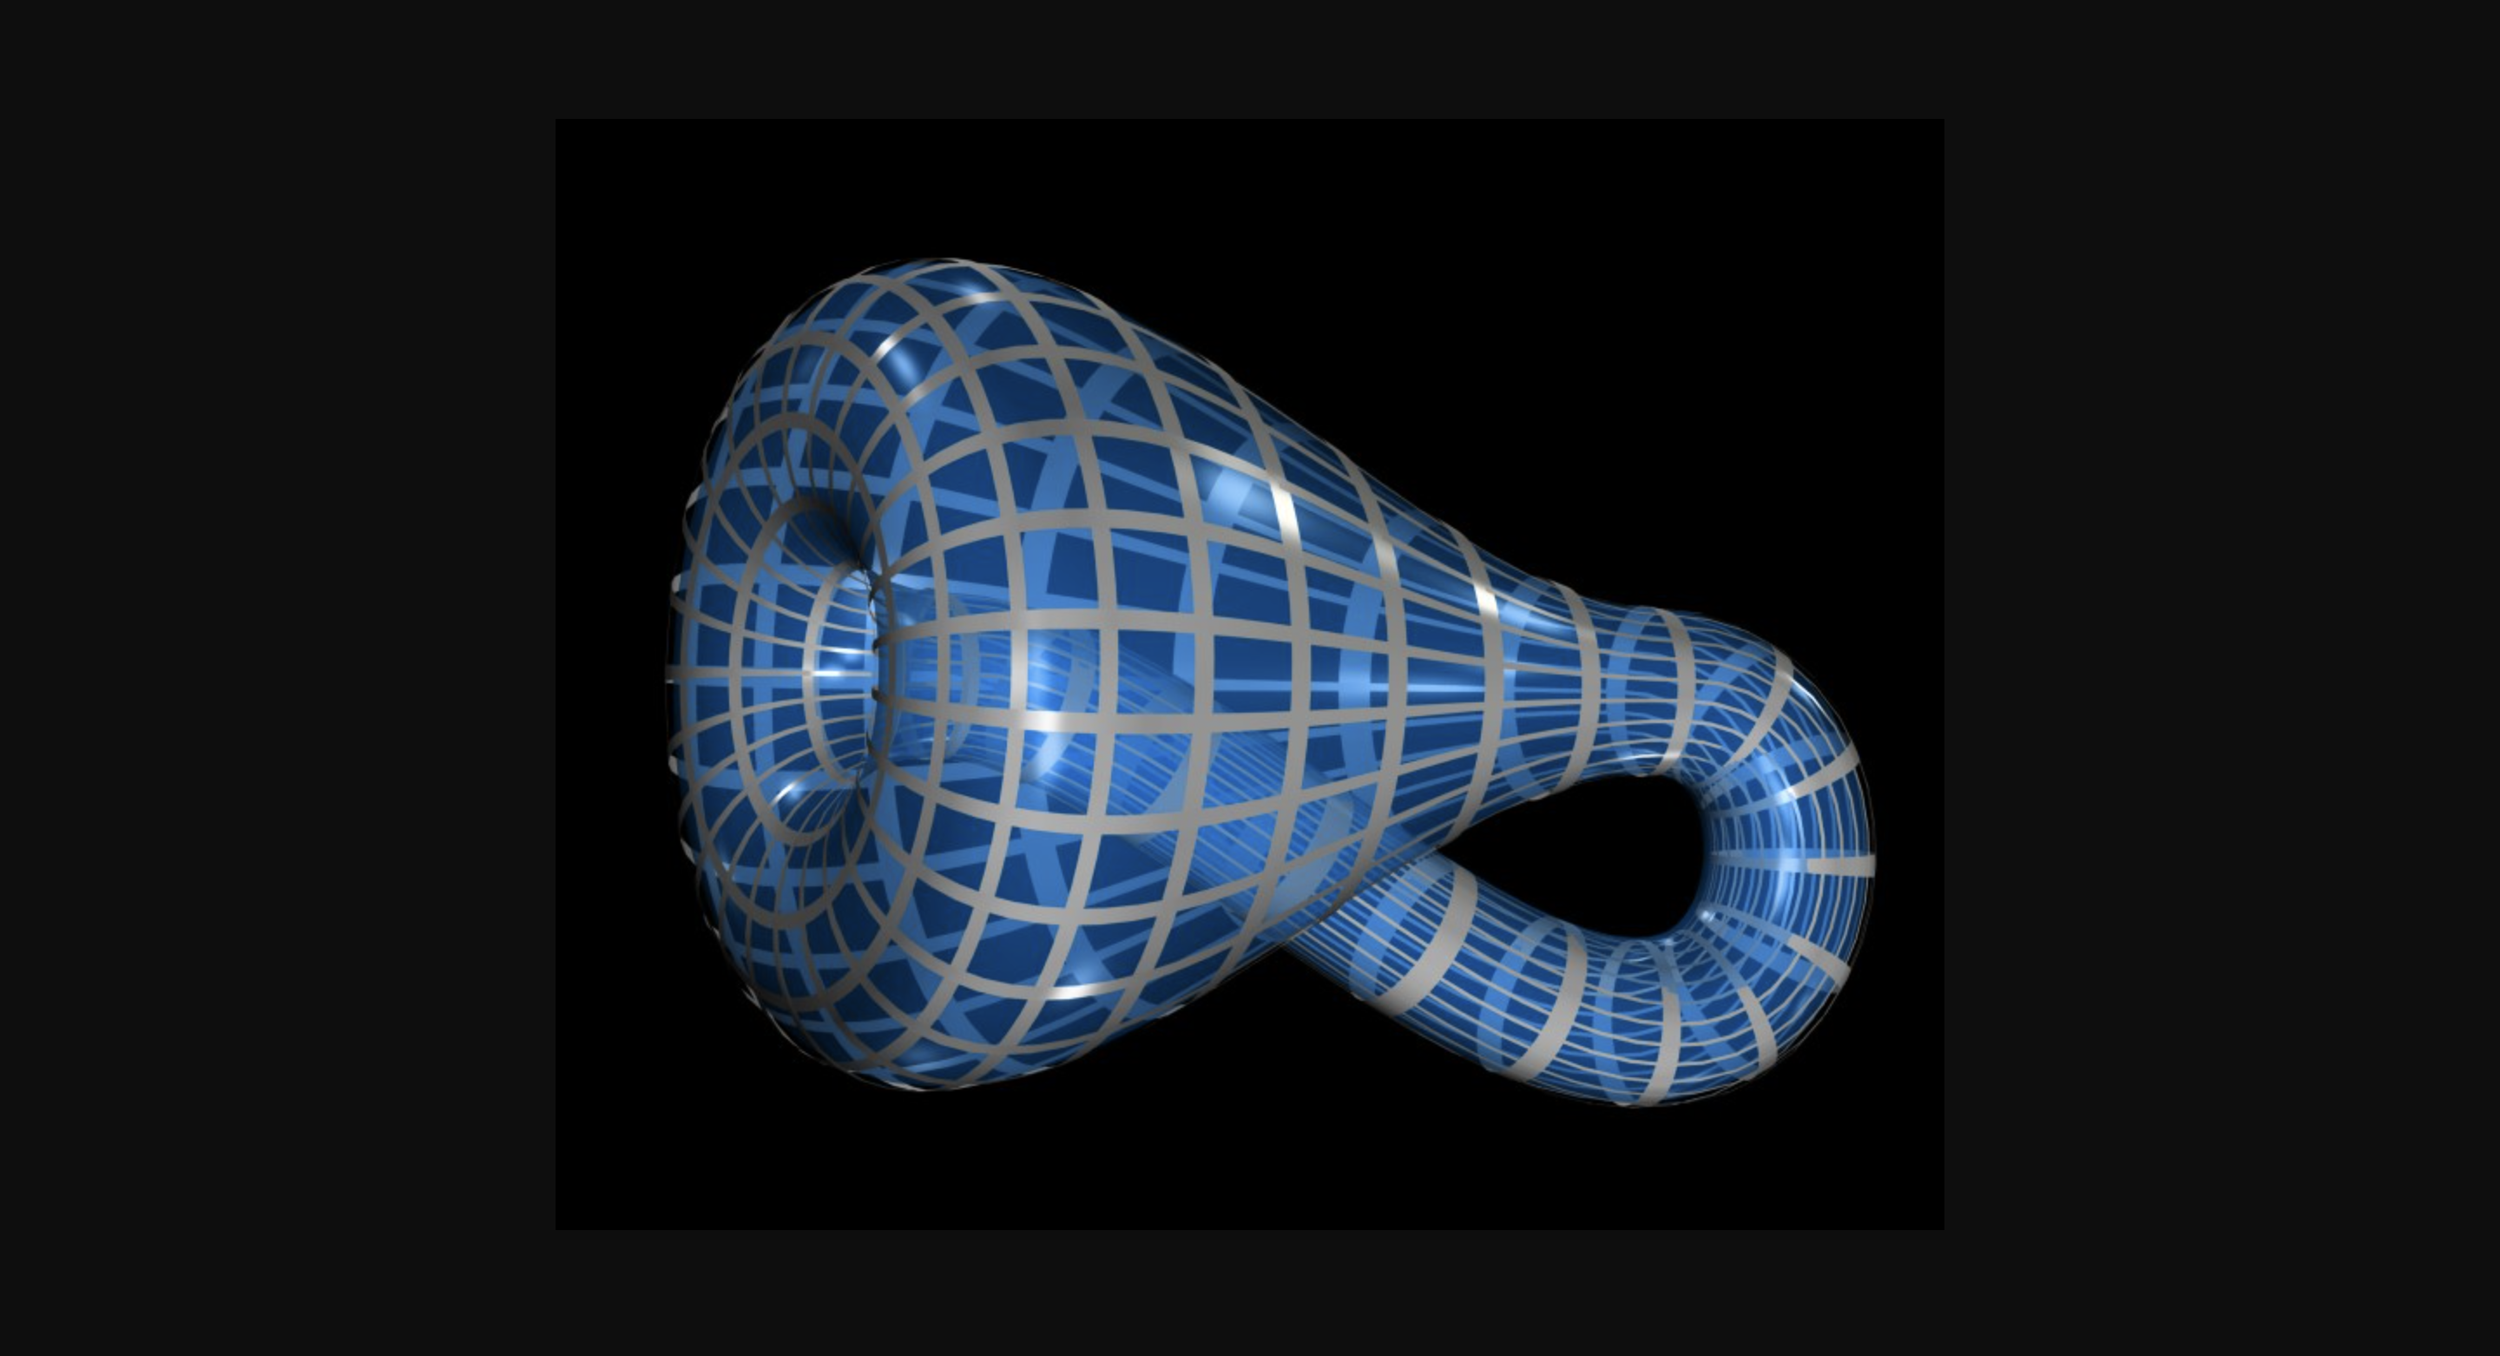
Improving CNNs with Klein Networks: A Topological Approach to AI

April 3, 2025
Evaluating LLM Hallucinations with BluelightAI Cobalt

March 27, 2025